- Housing starts are down YoY in 2026; tariff-driven lumber cost increases combined with 7.1% mortgage rates create a double supply constraint that builds the shortage further
- The lumber tariff chain: 25% tariff on Canadian lumber → $20,000+ added cost per new home → fewer starts → worsening shortage → higher prices — a federal policy with direct local impact
- 7.1% average mortgage rate is the highest since 2001; combined with elevated prices, monthly payments on the median home are ~50% higher than in 2020
- Suburban anger is the electoral consequence: households priced out in 2023–2026 are a concentrated bloc of frustrated would-be homebuyers in precisely the competitive suburban districts that decide the House
Housing Market Indicators: 2024 vs. 2026
| Indicator | Q4 2024 | Q1 2026 | Change | Primary Driver |
|---|---|---|---|---|
| Housing Starts (annualized) | 1.42M | 1.16M | -18% | Cost increases, rate uncertainty |
| Building Permits | 1.48M | 1.19M | -20% | Tariff-driven cost uncertainty |
| NAHB Sentiment Index | 46 | 37 | -9 pts | Lumber costs, buyer traffic drop |
| Lumber (per 1,000 board-ft) | $412 | $544 | +32% | 25% Canada tariff |
| 30-Year Mortgage Rate | 6.8% | 7.1% | +0.3pp | Fed hold, inflation premium |
| New Home Median Price | $408,000 | $431,000 | +$23,000 | Cost pass-through + rate |
| Months Supply (new homes) | 7.8 | 9.4 | +1.6 | Demand slowdown |
Census Bureau housing starts and permits data. Lumber pricing from Random Lengths composite. Mortgage rate from Freddie Mac Primary Mortgage Market Survey. NAHB/Wells Fargo Housing Market Index. Data through March 2026.

The Lumber Tariff Chain: From Canada to Closing Costs
Canada has been subject to US anti-dumping duties on softwood lumber since 2017, but the additional 25% tariff imposed on February 1, 2026, as part of the Canada/Mexico tariff package, has pushed the effective tariff rate on Canadian lumber to over 40% in many categories. Canada supplies approximately 30% of US softwood lumber consumption — a share that cannot be quickly replaced by domestic production, which faces its own cost and regulatory constraints. The result is a 32% increase in composite lumber prices since late 2025, adding an estimated $9,000-$12,000 to the cost of a new single-family home according to NAHB analysis.
The cost impact compounds beyond lumber. Steel tariffs add to the cost of structural beams, rebar, and HVAC systems. Aluminum tariffs raise window, door frame, and roofing component costs. The 145% tariff on Chinese goods affects the appliances (refrigerators, dishwashers, ranges) and plumbing fixtures that complete a new home. Each tariff layer adds to the total project cost that builders must either absorb, pass to buyers, or avoid by canceling projects. In a market where buyers are already stretched by 7.1% mortgage rates, passing through $10,000+ in tariff impacts is often not possible without pricing out the target buyer segment entirely.
Suburban Anger: The Political Geography of the Housing Crisis
Locked Out Again
Millennials aged 28-42 are the largest voting cohort and the group most directly affected by housing unaffordability. Many had hoped that post-COVID rate normalization would create a buying window; instead, tariff-driven construction cost increases and the Fed's inability to cut rates have kept mortgage payments at historic highs relative to income. This group's housing frustration is a politically exploitable issue for Democrats in suburban districts.
Blue-Collar Crosscurrent
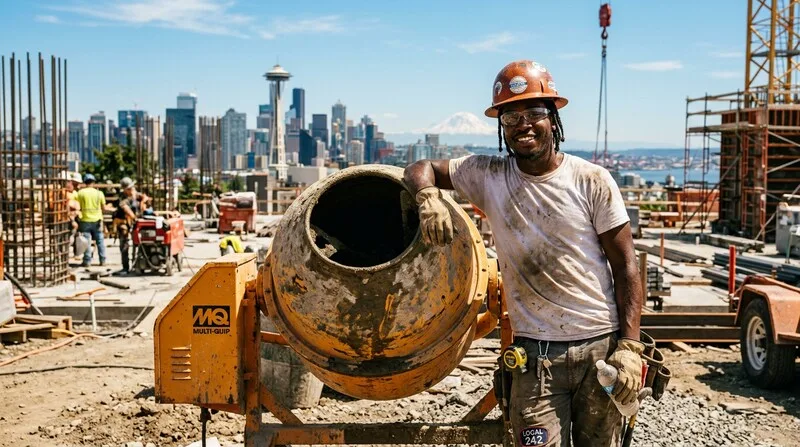
Residential construction employs roughly 3.5 million Americans, many of them in the working-class demographic that shifted toward Republicans in 2020 and 2024. An 18% decline in housing starts translates into reduced work hours and layoffs for framers, roofers, electricians, and plumbers — workers who are traditional Republican leaners but who are directly harmed by the tariff-driven construction slowdown that Republican policies created.
Sunbelt Suburbs Most Exposed
Texas, Florida, Arizona, and Georgia — states where suburban expansion drove housing demand — are seeing the sharpest declines in building activity. Competitive House districts in suburban Phoenix (AZ-01, AZ-06), suburban Dallas (TX-03, TX-24), and suburban Atlanta (GA-06, GA-07) all have significant concentrations of home builders, construction workers, and buyers who directly feel the housing cost crisis.